

Application performance monitoring gives engineering teams real-time telemetry to detect, diagnose, and resolve issues before users notice them. The immediate payoff is measurable: faster diagnosis of production problems shrinks mean time to resolution, and correlating metrics, traces, and logs turns guesswork into targeted fixes. This guide covers the metrics that matter, how to instrument mobile and cloud-native apps, and how to build an APM strategy that ties directly to your SLOs.
TL;DR:
- Ensuring tail latencies like p95 and p99 provide a more accurate picture of user experience than average response times, especially under 5% of requests that can take seconds.
- Instrumenting critical mobile transactions such as startup time, crash rate, and frame jank early and iteratively, rather than trying to cover everything at once, prevents alert fatigue.
- Starting with APM that captures key metrics and traces for essential services is sufficient for most teams before expanding to full observability as architecture complexity grows.
- Choosing an APM platform should focus on support for your stack, cost, security, and how well it enables you to define and measure meaningful SLOs first.
- Establishing realistic baselines from 30 to 45 days of production data, segmented by device and region, is essential before setting final performance thresholds.
Table of Contents
- What Metrics Should You Track for App Performance Monitoring?
- How Do You Instrument an App for Telemetry?
- Which Mobile Metrics Actually Predict a Bad User Experience?
- Do You Need Observability, or Is APM Enough?
- How Do You Choose the Right APM Approach?
- Your First 90 Days: An APM Implementation Checklist
- Amal's Take: Practitioner Notes on Building This Right
- What Trips Up Most Teams Doing App Performance Monitoring?
- How Does APM Fit Into CI/CD and DevOps Workflows?
- How Do You Set Performance Baselines and Benchmarks?
- How Do the Major APM Platforms Compare?
- The Real Lesson From the Data: Fewer Metrics, Watched Better
- Sources
- FAQ
What Metrics Should You Track for App Performance Monitoring?
Response time gets most of the attention, but the average hides the story. If your app responds in 200 milliseconds on average, that number means nothing if 5% of requests take four seconds. That's why engineering teams lean on latency percentiles, specifically p50, p95, and p99, to see what the slowest real users actually experience.
The p50 (median) tells you what's typical. The p95 tells you what your unluckiest 1-in-20 users see. The p99 catches the outliers who are quietly churning because your app stalls right when they need it most. A checkout flow with a great p50 but a terrible p99 is still losing sales, just from a smaller, angrier slice of your user base.
Beyond latency, a handful of other signals round out the picture:
- Throughput — requests or transactions per second, showing whether slowness comes from load or from a broken code path.
- Error rate — the percentage of failed requests, which separates "slow" problems from "broken" ones.
- Resource metrics — CPU, memory, disk I/O, and network usage, which help you tell a code problem from a capacity problem.
- Crash rate and ANR (Application Not Responding) events — user-facing failures that directly hit retention.
- Startup time and frame jank — how fast the app becomes usable and how smoothly it renders once it is.
Statistic to know: Android developer guidance explicitly recommends focusing on p95 and p99 tail latencies rather than averages, because tail behavior is what determines whether a subset of users has a genuinely broken experience.
Turning these into SLOs is where the engineering work becomes a business conversation. Instead of "we monitor latency," you write "checkout API p95 stays under 800ms, with an error budget of 0.1% over any rolling 30-day window." That single sentence gives your on-call team a trigger for alerts and gives your product leadership a number they can tie to conversion rate or support ticket volume. Mobile teams should track startup time, crash rate, time to interactive, and session metrics together rather than in isolation, since a fast but crash-prone app and a stable but slow one both fail users in different ways.
How Do You Instrument an App for Telemetry?
Metrics, traces, and logs each answer a different question, and conflating them is a common source of blind spots. Metrics tell you that something is wrong (error rate spiked at 2:14 AM). Traces tell you where it went wrong (the spike traces to a single downstream payment service). Logs tell you why (that service was retrying a call against an expired credential). You need all three, but you don't need all three everywhere.
Instrumentation approaches generally fall into three camps:
- Vendor SDKs and agents — quick to deploy, often auto-capture startup time, HTTP calls, and screen renders with minimal code.
- OpenTelemetry-native instrumentation — an open, vendor-neutral standard for collecting traces, metrics, and logs across services without locking you into one backend.
- Custom code traces — hand-written spans around business-critical logic that automatic instrumentation can't see, like a multi-step checkout or a fraud-check pipeline.
Firebase Performance Monitoring is a good illustration of what automatic instrumentation buys you out of the box: it measures app startup time, HTTP network requests, and screen rendering automatically, then lets you layer custom traces on top for the workflows that matter most to your business. That's a sensible default for teams that need fast time-to-value, but it comes with a trade-off worth naming: built-in agents and SDKs simplify data capture, but you still have to manage the production overhead and sampling rules yourself, or your telemetry pipeline becomes its own performance problem.
OpenTelemetry has become the standard many engineering teams migrate toward specifically to avoid vendor lock-in. If you're starting fresh, instrumenting with OpenTelemetry from day one saves you a painful re-instrumentation project later when you inevitably want to switch backends or add a second observability tool for a specific team.
Sampling strategy deserves real thought, not a default setting. Capturing 100% of traces on a high-traffic service will bankrupt your ingestion budget fast; capturing too little means the one trace you needed during an incident never got recorded. A common middle ground is tail-based sampling, keeping all traces for errors and slow requests while sampling normal traffic at 1 to 10%.

Telemetry also carries data you have to handle carefully. Traces and logs frequently capture user IDs, IP addresses, or request payloads that qualify as personal data. Strip or hash identifiers at the collection point rather than downstream, and apply the same discipline you'd use for secure application data handling to your observability pipeline, not just your production database.
Pro Tip: Instrument a small set of critical transactions first, such as login, checkout, and search, then expand iteratively. Trying to instrument everything on day one is the fastest route to alert fatigue and a dashboard nobody trusts.
Which Mobile Metrics Actually Predict a Bad User Experience?
Mobile performance has its own vocabulary, and conflating it with server-side APM metrics leads teams astray. A backend can be perfectly healthy while a mobile app feels sluggish because of a rendering bottleneck that never touches a server at all.
Startup time breaks into cold, warm, and hot starts. A cold start (launching from scratch) is the slowest and the one users judge you on hardest, since it's their first impression every single time the OS kills your process to reclaim memory. Warm and hot starts should be near-instant; if they're not, something is holding onto work it shouldn't.
Frame rendering runs on a strict budget: 16 milliseconds per frame to hit 60 frames per second. Miss that budget occasionally and you get jank, a visible stutter. Miss it badly, typically past 700 milliseconds, and you get a frozen frame, which reads to the user as the app hanging. Measuring frozen-frame counts per user journey, rather than just an aggregate rate, tends to surface the regressions that actually drive uninstalls, since a single terrible screen can sink an otherwise smooth app.
Beyond frames, watch for:
- ANR (Application Not Responding) events, which Android surfaces when the main thread is blocked too long.
- Crash rate, tracked per session and per device class, since a crash on a five-year-old phone is a different problem than a crash on a flagship.
- Memory pressure and low-memory-killer (LMK) signals, which predict crashes before they happen.
Statistic to know: Google's Play Console ties technical quality directly to visibility. Android vitals and the App Performance Score factor ANR rate, crash rate, and frame metrics into how discoverable your app is in the Play Store, meaning performance work isn't just a user-experience concern. It's an acquisition lever.
Getting reliable answers here requires both lab and field testing. Perfetto and Macrobenchmark give you controlled, repeatable lab measurements for catching regressions before release, while real user monitoring in the field catches the device fragmentation, network conditions, and edge cases a lab can never fully replicate. Neither alone tells the whole story. Static fixes, like adopting baseline profiles or moving to Jetpack Compose, often resolve the bulk of startup and rendering regressions before you need to touch runtime logic at all.

Do You Need Observability, or Is APM Enough?
APM is a focused capability: it watches known applications and services for known failure patterns, using metrics, traces, and logs you've decided in advance are worth collecting. Observability is the broader practice, treating your system as something you should be able to ask arbitrary questions about later, even questions you didn't anticipate when you set up monitoring.
For most teams, APM is the right starting point, not a compromise. You don't need full observability to catch a checkout API regression; you need latency percentiles, an error rate, and a trace that shows which downstream call is slow. Full observability earns its complexity when your architecture does too.
Signs you've outgrown APM alone:
- You run a microservices architecture where a single user request touches five or more services.
- You're on serverless infrastructure, where traditional host-level monitoring doesn't apply and cold-start behavior needs its own visibility.
- Your incident retros keep ending in "we don't actually know which service caused this," even after checking your dashboards.
- You're running containers at a scale where correlating logs across dozens of ephemeral pods by hand has become the bottleneck.
The practical path is incremental, not a rip-and-replace. Start with APM covering your critical transactions, add distributed tracing across the two or three services most often implicated in incidents, then broaden log correlation and custom dashboards as your architecture's complexity demands it. APM platforms that correlate metrics, traces, and logs in one view already give you most of what a full observability rollout promises, just scoped to the services you've chosen to watch closely, which makes the transition far less disruptive than jumping straight to a platform overhaul.
How Do You Choose the Right APM Approach?
Picking a monitoring approach is really a set of six trade-offs, and getting the order wrong wastes months of engineering time on data nobody trusts.
- Understand the cost model before you commit. Ingestion volume and retention windows drive APM cost more than seat count does. A platform that's cheap at your current traffic can get expensive fast once you scale traces across every service.
- Confirm OpenTelemetry support. Native OpenTelemetry compatibility protects you from a painful re-instrumentation project if you ever switch backends, and it matters more the larger your service count gets.
- Check platform coverage against your actual stack. Mobile, Kubernetes, serverless, and legacy on-prem services each have different instrumentation requirements; a tool that's excellent for containers may be an afterthought for mobile.
- Map alerting to your actual on-call workflow, not a generic template. If alerts don't route to the right team with the right context, your MTTR gains evaporate.
- Verify security, compliance, and data residency fit your requirements. Where telemetry data physically lives matters for regulated industries and for any team handling user PII.
- Draft SLOs before you finalize tooling, not after. An error budget of 0.1% and a p95 threshold of 500ms tell you exactly what alert thresholds to configure, which turns tool selection from a feature checklist into a fit-for-purpose decision.
Pro Tip: Write your SLOs on a whiteboard before you demo a single platform. Teams that shop for APM tools first and define SLOs later end up configuring alerts around whatever the tool measures easily, not around what actually matters to the business.
Mobile-specific projects add another layer, since startup, rendering, and stability metrics tie directly to store discoverability and retention in a way backend latency does not. If your roadmap includes a new mobile release, factor Android vitals thresholds into your SLOs from the start rather than retrofitting them after a Play Store visibility drop.
Your First 90 Days: An APM Implementation Checklist
Rolling out APM well is a sequencing problem more than a technical one. Try to do everything at once and you'll drown in alerts before you've learned anything useful.
- Days 0 to 14: Instrument the critical path. Get basic RUM and error capture running on your highest-traffic and highest-revenue transactions, login, checkout, search, whatever your business can't function without.
- Days 15 to 45: Establish baselines. Run lab benchmarks alongside your new field data, then set initial SLOs and alert thresholds based on what you're actually seeing, not industry averages.
- Days 46 to 75: Tune and expand. Cut alert noise by adjusting sampling and thresholds, then add distributed tracing to support root-cause workflows for your two or three most incident-prone services.
- Days 76 to 90: Close the loop. Run a postmortem on the incidents your new telemetry caught, measure how much your MTTR actually improved, and revise your SLOs based on real evidence instead of guesses.
A few habits make this sequence work instead of stalling out:
- Resist instrumenting everything in week one; a flood of low-value alerts kills team trust in monitoring faster than almost anything else.
- Treat your first SLOs as drafts, not commitments; you'll adjust them once you have 30 to 45 days of real baseline data.
- Assign a single owner for alert tuning during the first 90 days, or noise reduction becomes nobody's job.
Teams building or re-architecting mobile products around this timeline often benefit from folding performance instrumentation into the mobile app development process itself, rather than bolting it on after launch.
Amal's Take: Practitioner Notes on Building This Right
Performance monitoring work at Proud Lion Studios runs through the same lens covered here: instrument the transactions that matter to the business first, set SLOs against real baseline data, and treat mobile lab testing and field telemetry as two halves of one picture, not competing options. Teams researching this topic often also want a sense of how monitoring decisions connect to the bigger architectural question of whether an app can handle growth, which is covered in Proud Lion Studios' work on app scalability planning.
What Trips Up Most Teams Doing App Performance Monitoring?
The most common failure isn't missing tools, it's missing discipline. Teams instrument dozens of services simultaneously, generate a wall of alerts nobody can triage, and abandon the dashboard within a quarter. Alert fatigue is the single fastest way to kill trust in monitoring data.
A second pitfall: chasing averages instead of tail latencies. A team that celebrates a great average response time while ignoring p99 spikes is optimizing for a metric that doesn't reflect what unlucky users experience.
Sampling misconfiguration causes quieter damage. Teams that sample too aggressively lose the exact trace they need during a real incident; teams that sample too little run up ingestion costs that eventually force a rollback of the whole telemetry effort.
Finally, many teams treat mobile and backend monitoring as one problem, when they require different tooling and different metrics entirely. A backend team can hit every SLO while a mobile release ships with a rendering regression nobody caught, because nobody was watching frame timing at all. The fix in every case is the same: instrument fewer things well, tie thresholds to real baselines, and revisit both regularly instead of setting them once and walking away.
How Does APM Fit Into CI/CD and DevOps Workflows?
APM data belongs inside your deployment pipeline, not just your production dashboard. Running lab benchmarks such as Macrobenchmark as a CI gate catches startup time or frame rendering regressions before they reach users, turning a post-release firefight into a blocked pull request.
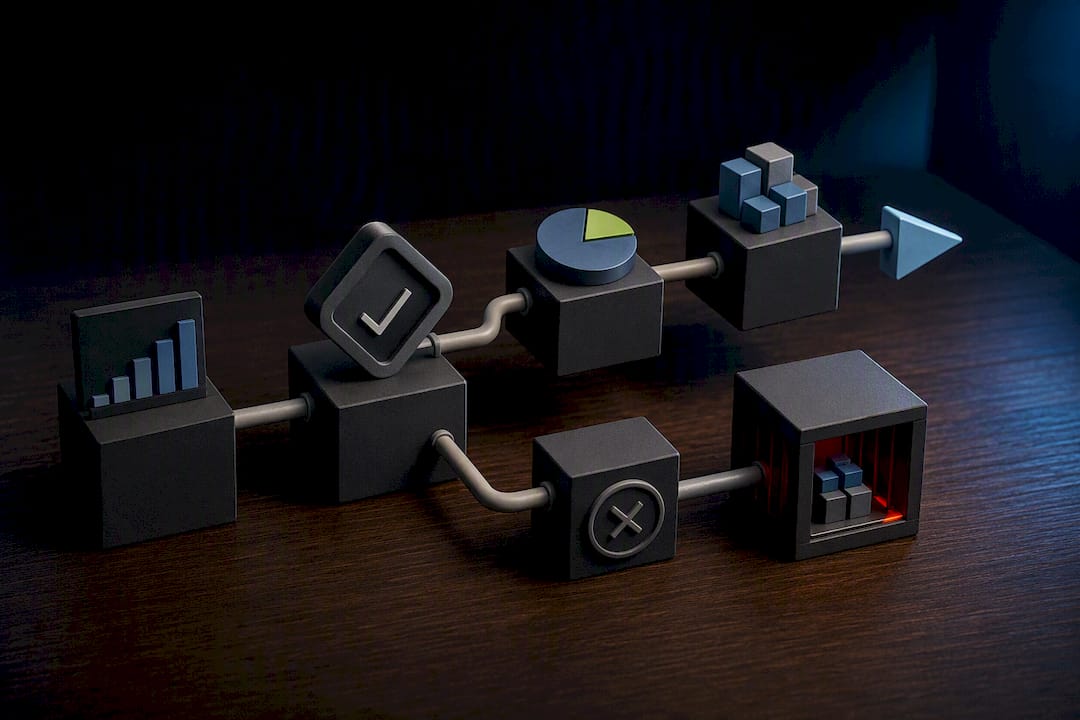
The most effective DevOps workflows treat performance budgets like test coverage: a build that regresses p95 latency past an agreed threshold fails the same way a broken unit test would. That requires wiring your telemetry platform's API into your CI/CD tool so benchmark results post directly to the pull request, not buried in a separate dashboard someone has to remember to check.
Canary and progressive rollout strategies pair naturally with APM here. Ship a change to 5% of traffic, watch error rate and p95 latency in real time, and automate a rollback trigger if either crosses a threshold. This turns your monitoring stack into an active participant in the deployment process rather than a passive record of what already went wrong.
How Do You Set Performance Baselines and Benchmarks?
You cannot set a meaningful SLO without knowing what "normal" looks like first. Baselining means collecting 30 to 45 days of real production data across your key metrics, response time percentiles, error rate, crash rate, before locking in any alert threshold.
Baselines should be segmented, not aggregate. A p95 that looks healthy across your whole user base can hide a terrible experience for users on older Android devices or slower networks; segment by device class, region, and app version to catch that. Re-baseline after any major release or infrastructure change, since a new framework version or a backend migration resets what "normal" means.
How Do the Major APM Platforms Compare?
Rather than ranking specific vendors, it helps to compare APM platforms by capability category, since the right fit depends heavily on your stack.
| Category | Strength | Watch for |
|---|---|---|
| Cloud-native / full-stack platforms | Deep tracing across microservices and containers | Ingestion cost scales fast with service count |
| Mobile-focused SDKs | Automatic startup, network, and rendering capture out of the box | Less useful for backend-heavy diagnosis |
| Open-standard (OpenTelemetry-based) tooling | Vendor neutrality, easier backend migration later | May require more setup effort than turnkey agents |
| Enterprise observability suites | Broad log, metric, and trace correlation at scale | Overkill and costly for smaller service counts |
Match the category to your actual architecture rather than the platform with the longest feature list. A five-service mobile-first startup and a fifty-service enterprise platform have almost nothing in common in terms of what "the right APM tool" looks like.
If your team is building or re-architecting a mobile product and wants performance monitoring designed in from the start rather than retrofitted, Proud Lion Studios' mobile app development services) fold instrumentation, SLO planning, and lab-plus-field testing into the delivery process itself.
The Real Lesson From the Data: Fewer Metrics, Watched Better
The evidence here points somewhere uncomfortable for teams that love dashboards: more metrics rarely mean more reliability. The Android ecosystem's own guidance backs a narrower approach, tail latencies over averages, a handful of critical transactions over blanket instrumentation, lab tests paired with field data rather than either alone.
Conventional advice oversells tooling and undersells discipline. A team with a mediocre APM platform and disciplined SLOs will outperform a team with a best-in-class platform and no baseline data, every time. The tool correlates traces; it doesn't decide what matters.
If you're starting from zero, prioritize the SLO conversation before the vendor demo. Decide what "good" means for your three most critical transactions, in numbers, before you touch a configuration screen. Everything else, sampling rates, alert routing, dashboard design, follows naturally once that foundation is set. Skip it, and you'll spend a year tuning alerts for thresholds nobody agreed mattered in the first place.
— Amal
Sources
For hands-on implementation, keep these close: Google Cloud's overview of application performance monitoring, Firebase's Performance Monitoring documentation for mobile SDK instrumentation, Android's guide to measuring performance with Perfetto and Macrobenchmark, the Android vitals reference for store-visibility thresholds, AWS's explanation of telemetry correlation, and the OpenTelemetry project docs for vendor-neutral instrumentation standards.
- What is application performance monitoring (APM)?
- Firebase Performance Monitoring documentation
- Measuring performance - Android Developers
FAQ
How Do You Monitor Application Performance?
You monitor application performance by instrumenting critical transactions with telemetry (metrics, traces, and logs), setting baselines from real production data, and configuring alerts against SLOs like p95 latency and error rate thresholds. Combining real user monitoring with lab-based synthetic tests gives the most complete picture.
What's the Best Application Performance Monitoring Tool?
There's no single best tool; the right choice depends on your architecture, with open-standard OpenTelemetry-based platforms offering flexibility for teams that want to avoid vendor lock-in, and mobile-focused SDKs like Firebase Performance Monitoring suiting teams that need fast, automatic startup and rendering data.
What Does "Application Performance Monitoring" Mean?
Application performance monitoring (APM) is the practice of using software tools and telemetry to observe an application's operational health, giving teams code-level insight to detect and resolve issues before they affect users.
Which App Is Good for Monitoring?
For mobile apps specifically, tools that combine automatic instrumentation (startup time, network calls, rendering) with lab testing tools like Perfetto and Macrobenchmark tend to give the most reliable results, since lab and field data together catch issues neither approach finds alone.
How Often Should You Revisit Your SLOs?
Revisit SLOs after any major release, architecture change, or infrastructure migration, and treat your first set of thresholds as a draft based on 30 to 45 days of baseline data rather than a permanent target.